


Overview
The global flying cars market is projected to expand from US$ 6.4 billion in 2026 to approximately US$ 5.3 trillion by 2035, registering an exceptional CAGR of 111.1% between 2026 and 2035. The extensive growth is a result of both technological progress and the match between aerospace engineering, manufacturing of automobiles, artificial intelligence, aviation infrastructure and supportive regulation of these spheres The spread of commercial applications of flying cars beyond China into other global economic powers will ensure their integration into future transport systems and the total restructuring of how people and cargo move globally.
The market is on the verge of its revolutionary phase as further advancements in technologies of electric propulsion, autonomous flight capabilities, lightweight design and digital aviation infrastructure are bringing the sector from the prototyping stage to actual commercial application. A vision which previously seemed like science fiction is fast becoming a reality, representing a means of transport which could solve many problems of the modern world such as urban traffic, poor connectivity of remote areas, slow reaction time of emergency services and the need for sustainable transport. Differentiating itself from conventional air transport vehicles, modern flying cars are capable of VTOL and are not dependent on any airport facilities because of small operating area.
However, the commercialization timetable has greatly advanced in recent years as aviation regulatory agencies have created specific certification routes for powered-lift air vehicles. The FAA in the United States, the EASA in the European Union, CAAC in China and the JCAB in Japan are collaborating with industry companies to certify next-generation aircraft for commercial applications.
EHang, Joby Aviation, Archer Aviation, Volocopter, XPeng AeroHT, Vertical Aerospace, SkyDrive and Eve Air Mobility have completed thousands of tests for their aircraft and proven the efficiency of propulsion systems, flight control software, autonomy and safety under operational conditions to lower technical uncertainty and bolster investors’ confidence in the AAM industry.
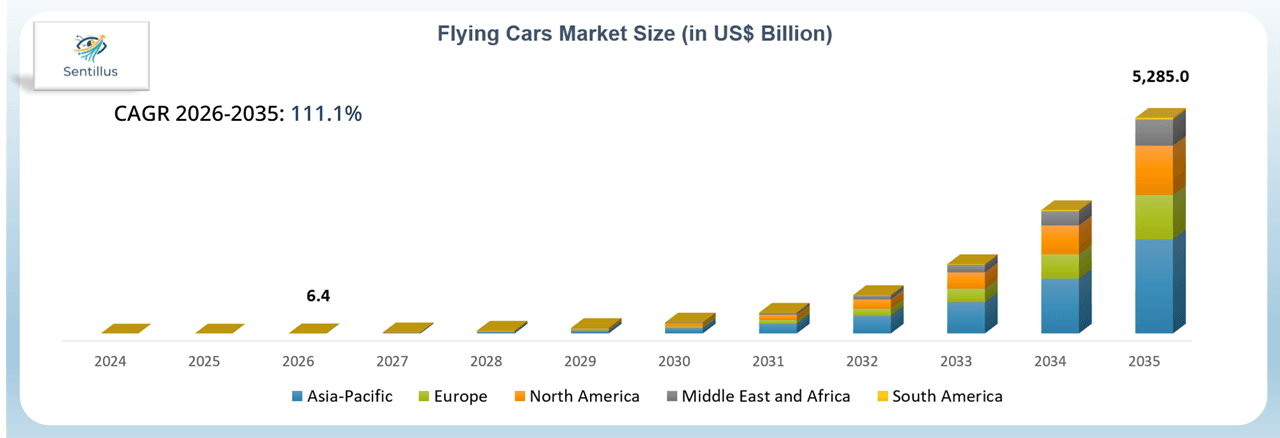
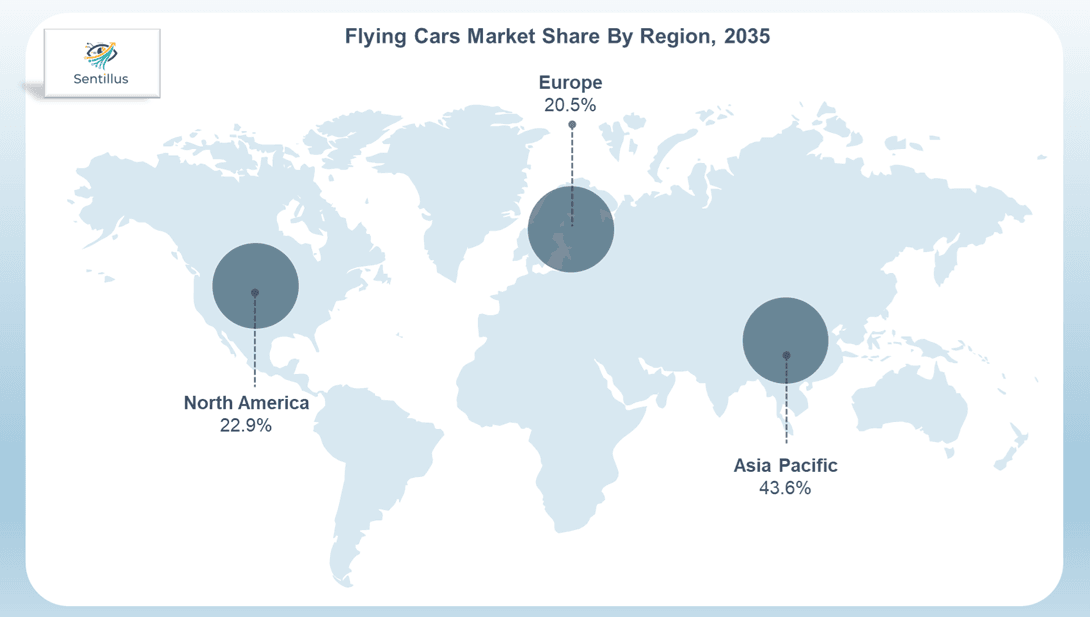
China is the world leader since flying cars is incorporated in its country’s low-altitude transport strategy. China has set up demonstration zones, expedited certification processes, promoted investments in vertiports and facilitated commercial projects that involve passenger transport, logistics, tourism and emergency applications. First mover advantage gives Asia-Pacific as the sole revenue generating region in the initial commercialization phase. As a result, the global flying cars market has reached a valuation of US$ 6.4 billion in 2026, with Asia-Pacific accounting for 100% of the revenue as the first region where commercialized and certified flying cars have been deployed. The gradual expansion of commercialization to North America, Europe and Middle East will diversify regional revenues. In 2035, Asia-Pacific will lead the market with a market share of 43.6%, followed by North America with 22.9% and Europe with 20.5% market shares.
The growth rate will vary based on the preparedness to regulate the market, manufacturing capability, infrastructure development and governmental policies. China is anticipated to be the largest market in terms of individual markets, contributing up to 26.0% of the global revenue, owing to manufacturing capabilities in the country, infrastructure development by the government and early commercialization. On the other hand, the U.S. is anticipated to contribute 19.0% of global revenue due to FAA certification progress, massive investments from aerospace, technology firms and increasing UAM piloting programs.
India Flying Cars Market is expected to comprise 6.1% of the global market by 2035, driven by increased investments from local startups, associations with research organizations, development of smart cities and government emphasis on next generation transport technologies.
Innovation in technology continues to be the key growth factor. Advancements in battery energy density, are helping increase flight times while decreasing aircraft weight thus helping in making aircraft more economical to operate. Artificial Intelligence is increasing capabilities in autonomous navigation, obstacle detection, prediction, maintenance and fleet management. Digital air traffic management systems are also being developed which can help in integrating flying cars in aviation networks at lower altitudes. Furthermore, there have been rapid advancements in electric engines, distributed lift technologies, fly-by-wire controls and composite structures of aircrafts.
Flying cars offer a three-dimensional mobility solution capable of significantly reducing travel times without requiring extensive investments in new highways or rail corridors. In most urban centers, commuters waste several hundred hours per year due to traffic jams, while emergency services and logistic companies experience growing delays in the delivery of goods and services.
While the biggest long-term potential exists in passenger transportation, commercialization is anticipated to be made in many different sectors. Transport of air taxis, medical emergencies, logistics for cargo, disaster relief, infrastructure inspection, tourism, military and government operations are some examples that are anticipated to add to early revenue realization. From all of the above applications, it is estimated that the market opportunity arising from the use of air taxi passenger transport will amount to US$ 157.1 billion in 2030 and US$ 2.55 trillion in 2035, indicating the significant contribution that it makes in terms of being the main commercial application of flying cars.
From the technological point of view, the share of eVTOLs will be nearly 100% in the beginning of commercialization period, with total revenues amounting to US$ 6.3 billion in 2026, due to the high degree of maturity and rapid certification process of these technologies, in contrast to roadable vehicles. However, roadable flying cars will have the largest growth rates due to the maturing of the underlying technologies, which will bring revenues to US$ 111.9 billion by 2035 with a CAGR of 142.8%. Also, piloted aircraft will dominate at the beginning of commercialization with total revenues of US$ 5.2 billion in 2026.
Market Dynamics
Driver: Advancements in Electric Aviation Technologies and Regulatory Certification Accelerating Commercial Deployment
Rapid development in technology and regulations has caused the flying car to evolve from an experimental vehicle into a commercially viable aircraft. In the last ten years, great advances have been made in electric propulsion technologies, battery energy density, lightweight composites, distributed electric propulsion, digital flight control systems and autonomous flight control, which have greatly increased the safety and efficiency of the aircraft. Meanwhile, aviation organizations across the world have developed specific certifications for powered lift vehicles, which has lowered one of the biggest obstacles faced by the industry.
Segment Analysis
By Type: eVTOL Aircraft Segment Dominates the Market Due to Faster Commercial Readiness and Regulatory Progress
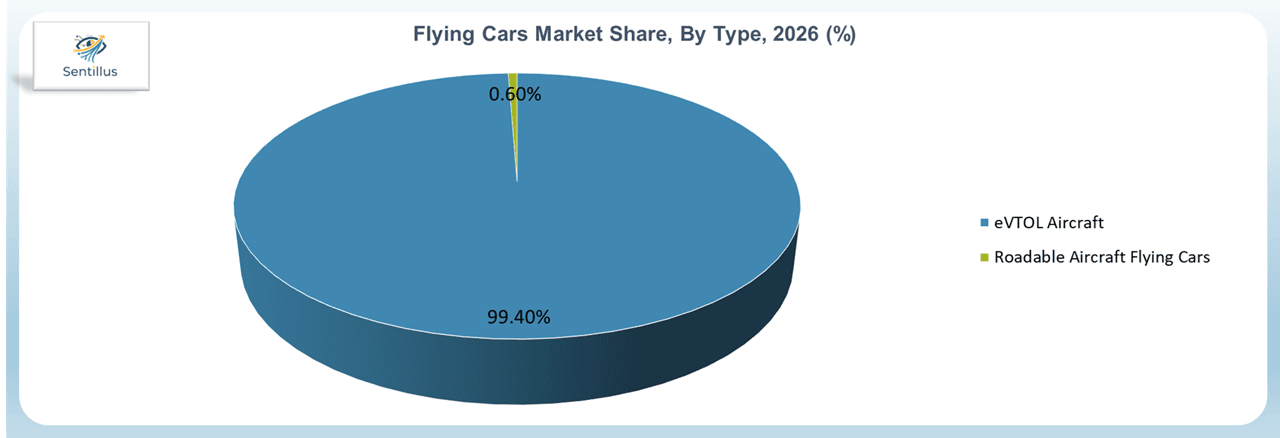
The eVTOL aircraft market is estimated to bring in around US$ 6.3 billion worth of revenue in 2026, covering almost the entirety of the commercial sector as the certification process starts in China. The roadable flying cars will take longer to commercialize due to their complicated engineering and dual regulation process. However, constant innovation will continue to help them penetrate the market as the Roadable Aircraft Flying Cars market is predicted to achieve around US$ 3.9 billion by 2030, growing at a CAGR of 142.8%. Regardless of this massive growth potential, eVTOL aircraft are likely to serve as the main basis for passenger transport, fleet management, cargo operations, emergency purposes and government use in the coming years due to its better commercialization and regulations processes.
EVTOL aircraft is considered the technology base of the global market for flying cars and is predicted to maintain its leading position during the entire projection period. In contrast to roadable flying cars, which need to be certified in both automotive and aviation sectors, EVTOL aircraft are meant to operate only in the air; therefore, the main goal for the developers is obtaining an aviation certification and faster deployment. The benefits of the simplified design, distributed electric power plant, reduced maintenance needs and compatibility with the emerging vertiports infrastructure made them more preferable than other vehicle types for many companies and governments’ AAM programs.
By Application: Air Taxi Passenger Transport Emerges as the Primary Revenue Generator
The Air Taxi Passenger Transport is projected to create a market opportunity of US$ 157.1 billion by 2030, expanding to nearly US$ 2.55 trillion by 2035. The growth is attributed to growing commercial implementations in Asia-Pacific, North America and Europe through improved certification, vertiport developments, increased customer acceptance and reduced cost of operations of aircrafts. As cities increasingly integrate Advanced Air Mobility into multimodal transportation planning, passenger air taxi services are expected to become the cornerstone application driving long-term growth across the global flying cars market.
Air taxi passenger transport is expected to become the largest application within the flying cars market as governments, aircraft manufacturers, infrastructure developers and mobility operators increasingly prioritize urban and regional passenger transportation. The segment directly addresses one of the most significant global transportation challenges-rapidly increasing travel demand within densely populated metropolitan areas where conventional road infrastructure is approaching practical capacity limits. By enabling direct point-to-point travel above congested road networks, flying cars can significantly reduce journey times while offering a premium mobility alternative for both business and personal travel.
While cargo transportation, medical evacuation, disaster response, tourism and defense applications will contribute meaningful revenue during the industry’s early years, passenger transportation is expected to remain the largest long-term revenue opportunity because of its significantly larger addressable market and higher fleet deployment potential.
Regional Analysis
United States Flying Cars Market Analysis
U.S. is expected to account for 19% share of overall flying cars revenues in the world by 2035 and to be the second largest market in the world after China. Its regulatory improvements, infrastructure developments and commercialization by domestic firms will position it among the pioneers in aerial mobility innovations.
USA well-developed aerospace ecosystem, substantial investments from venture capitalists, progressive regulations in aviation, as well as one of the largest innovative networks in urban air mobility are among reasons for this forecast. The U.S. will lag behind China in the commercialization process, but it has significant advantages due to its experience in aircraft production, high-quality digital infrastructure, experienced aviation staff and good cooperation of regulators and businesses.
One of the leading contributors to commercialization efforts is the Federal Aviation Administration (FAA), which has introduced the Innovate28 program to develop the basis for the introduction of Advanced Air Mobility into the National Airspace System by the 2028 Los Angeles Olympic Games. At the same time, the U.S. Department of Transportation supports pilot projects for introducing the technology that will enable manufacturers to prove their operational procedures, vertiport design, emergency management and other aspects of their performance.
The United States possesses some of the world-renowned companies in the area of Advanced Air Mobility, including Joby Aviation, Archer Aviation, Beta Technologies, Boeing, Wisk Aero, Electra.aero and many other software providers. All these firms have secured billions of dollars of investments from investors and created manufacturing sites for the future commercialization of these technologies. Collaborations with airlines, airports, rideshare services and infrastructure developers are creating an ecosystem of technologies going beyond simple airplane manufacturing to include charging stations, online booking systems, maintenance network and more.
Initial commercial need will most likely come from high population centers like New York, Los Angeles, Dallas, Miami, San Francisco and Chicago, whose airports, commercial transportation, tourism and regional movement hold a lot of economic value. In addition, medical emergencies, disasters, military operations and cargo transport are other areas that can yield some early commercial income prior to general consumer adoption.
Japan Flying Cars Market Analysis
Japan is one of the early adopters of flying cars due to its government policy that supports advanced air mobility (AAM). It is known that Japan has advanced aerospace engineering capacity and also aims at solving urban and regional connectivity problems. Japan stands out from other countries in terms of the way the process of commercialization is carried out, with government agencies, aviation regulators, car manufacturers, tech firms and educational institutions collaborating in the process. As a result, the development process of such innovations is much faster.
The main growth driver is the aging population and lack of workers in the rural areas. It becomes difficult for people to access transportation means in the areas that suffer from the decline of public transportation and have difficult terrain. Flying cars can be used for reaching the islands and remote areas where it becomes difficult to construct the traditional transportation system. Aircraft will not only be useful for passenger transportation but also for emergency services, tourism and logistics.
The domestic firms keep on reinforcing Japan’s competitive advantage. SkyDrive has successfully carried out several tests of flights while simultaneously making efforts toward certifying its mini eVTOL vehicle. Several automobile giants such as Honda and Toyota have made investments in the technology of advanced air mobility, which illustrates the gradual convergence of the auto industry and aerospace industry. Such manufacturing skills will facilitate mass production in the future.
India Flying Cars Market Analysis
India is projected to become one of the fastest-growing markets of flying cars, due to its urbanization growth, technological progress, government support of modern transportation solutions and the growth of domestic aerospace businesses. Despite the fact that flying car commercialization will start later compared to that in China, India still possesses significant potential for growth in the future, taking into account its large number of urban inhabitants, growth of disposable incomes, investments in smart cities and the growing need for effective means of transportation.
Traffic congestion is among the main problems of transportation in India. Such large cities as Delhi, Mumbai, Bengaluru, Hyderabad, Chennai and Pune are heavily congested, leading to increased time of traveling, fuel use, logistics costs and pollution. Modern transport systems would not be enough to meet the future needs because of the increasing number of urban residents. Flying cars might turn out to be a new level of mobility that can help solve traffic problems.
Government schemes are making positive impacts towards improving the future prospects of the sector, including Make in India, Digital India, Smart Cities Mission and National Logistics Policy programs that are motivating investments for the development of modern transport infrastructure and manufacturing. On the other hand, DGCA is partnering with Indian inventors to create a regulatory framework for future eVTOL certification and operations.
India has emerged to be one of the most promising markets when it comes to startups in the flying cars market. It includes companies such as The ePlane Company, Sarla Aviation, Vinata Aeromobility and some research organizations that are involved in designing indigenous aircraft technologies related to urban air mobility, EMS and regional connectivity solutions. Many academic partnerships happened recently involving IIT Madras and other institutions specializing in engineering.
India also offers long-term manufacturing advantages because of its competitive labor costs, expanding aerospace supply chain and established automotive manufacturing ecosystem. Global aircraft manufacturers are increasingly evaluating India as a future manufacturing and engineering hub for advanced air mobility components, software development and digital engineering services. The growing digitization in India also acts as enabler for adoption of flying cars. Usage of smartphones, digital payments systems, AI-powered mobility solutions, cloud computing and 5G are some technological enablers which make India a suitable place for management of fleet, booking of passengers, maintenance services and autonomous flight.
According to reports by Sentillus, by 2035 India is expected to contribute around 6.1% share in the global flying cars market. With further growth in indigenous technology development, regulatory framework and infrastructure in urban mobility, India would become a hub for flying cars’ manufacturing and deployment.
UAE Flying Cars Market Analysis
As part of the long-term strategy in smart cities and economy diversification, the United Arab Emirates have become among the most progressive markets for flying cars through the inclusion of Advanced Air Mobility. In contrast to bigger markets characterized mainly by large population, the competitive edge of the UAE is determined by active governmental policy, quick decision-making process in regulation, advanced infrastructure and readiness to embrace new means of transportations. All this makes UAE one of the first countries outside Asia which can implement commercial flying cars.
Dubai and Abu Dhabi governments always actively invested in intelligent transport systems, autonomous mobility, artificial intelligence and digital infrastructure development. Aerial mobility was officially recognized by governmental institutions as a part of the future transport system and there were several pilot projects launched that involve leading international aircraft manufacturers and infrastructure providers. Small size of the country’s territory and concentration of commercial activities positively affect the feasibility of premium air taxis.
Every year, many millions of international tourists visit UAE, due to its scenic beauty, several international expositions, conferences and sporting events. Flying cars could be used to offer premium airport transfers, sightseeing tours, luxurious tourism experience and fast business transportation from the business centers, hotels, airports and entertainment zones. The areas require a greater revenue per capita than usual public transportation, thus, increasing the efficiency of flying car fleet at the stage of the initial commercialization of the industry.
The UAE also became an ideal place for testing new technologies, as its regulatory policy is very flexible. Cooperation of airplane manufacturers, aviation organizations, airports and technology developers helps to speed up commercial testing and gather information necessary for further expansion to other regions. UAE advantages position makes it the Middle East’s leading flying cars market and an important gateway for commercial deployment across the wider Gulf region.
Key Developments
| Company | Strategy | Month & Year | Development |
| Joby Aviation | Certification | March 2026 | Joby Aviation Conducted the successful first flight of its FAA-conforming production-intent electric air taxi, marking a major milestone toward FAA Type Inspection Authorization (TIA). The aircraft features six tilt rotors and is designed to carry one pilot and four passengers for commercial urban air mobility operations. |
| Boeing | Product Launch | March 2026 | Introduced its Generation 6 autonomous four-passenger eVTOL air taxi, designed for self-flying urban transportation. The new platform incorporates autonomous flight technologies and supports Boeing’s strategy to advance passenger eVTOL certification and commercialization. |
| Archer Aviation Inc. | Government Partnership & Expansion | March 2026 | Selected for the U.S. Department of Transportation’s eVTOL Integration Pilot Program (eIPP). Archer will conduct pilot operations across Texas, Florida and New York to accelerate real-world deployment and support future FAA regulations for commercial air taxi services. |
| SAMSON SKY, LLC | Partnership | March 2026 | Signed a Memorandum of Understanding (MoU) with the Government of Tajikistan to support flying car regulations, pilot training programs and the planned sale of 50 Switchblade Flying Car units, expanding its international market presence. |
| XPeng AeroHT (XPeng Inc.) | Manufacturing Expansion | January 2026 | Began test production at its approximately 10,000-unit annual capacity manufacturing facility while advancing IPO preparations and targeting first customer deliveries in late 2026, marking a significant step toward mass production of consumer flying cars. |
| Horizon Aircraft | Product Launch | January 2026 | Announced major design upgrades for the Cavorite X7 hybrid-electric eVTOL, including a 12-lift-fan configuration, enhanced aerodynamics, an extended passenger cabin and improved operational efficiency to strengthen certification readiness and commercial competitiveness. |
| Volocopter GmbH | Certification & Product Launch | January 2026 | Advanced certification activities for both the VoloXPro light-sport eVTOL and the VoloCity passenger air taxi while optimizing its supply chain to accelerate commercialization of urban air mobility services. |
| Eve Holding, Inc. | Certification | December 2025 | Successfully completed the maiden flight of its eVTOL prototype, validating propulsion, flight-by-wire systems and aircraft architecture. The milestone initiated an expanded flight-test campaign supporting certification and commercial entry into service. |
| Vertical Aerospace Ltd. | Product Launch | December 2025 | Launched the Valo eVTOL flying taxi, designed for passenger transport, cargo logistics and emergency response missions. The aircraft incorporates advanced fly-by-wire controls and enhanced safety technologies to improve urban mobility efficiency. |
| EHang Holdings Limited | Partnership and Geographic Expansion | December 2025 | Collaborated with the Government of Thailand and aviation authorities to accelerate the development of an urban air mobility ecosystem, including regulatory frameworks, infrastructure development and deployment of autonomous air taxis across Southeast Asia. |
| EHang Holdings Limited | Product Launch | October 2025 | Unveiled the VT-35 next-generation autonomous flying taxi, featuring extended range capabilities for intercity and regional travel while integrating with the existing EH216-S ecosystem to expand scalable advanced air mobility operations. |
BCG Matrix
| Company | BCG Position | Assessment |
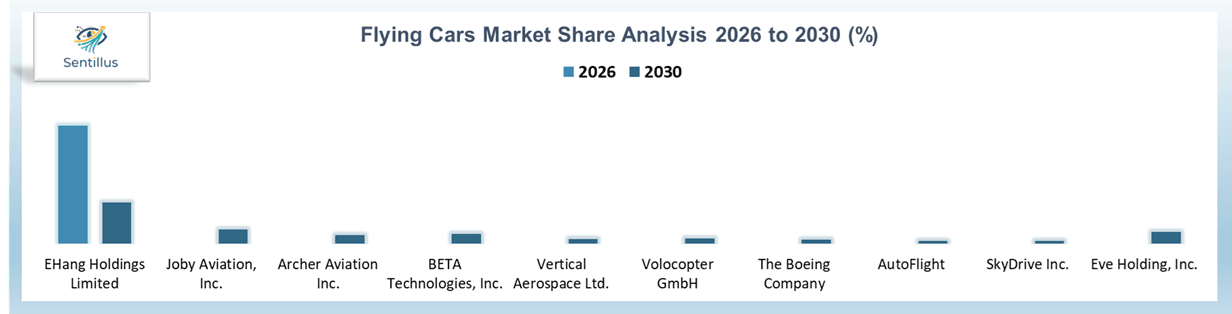
| EHang Holdings Limited | Star | EHang has established the strongest first-mover advantage through commercial deployment in China, certified autonomous passenger aircraft and government-backed low-altitude economy initiatives. Its early commercialization and expanding ecosystem position it as the current market leader. |
| Joby Aviation | Star | Joby continues advancing FAA certification, production-scale manufacturing and commercial partnerships with airlines and infrastructure providers. Strong technological capabilities and regulatory progress make it one of the industry’s highest-growth companies. |
| Archer Aviation | Star | Archer is rapidly expanding through strategic partnerships, government-supported pilot programs, manufacturing investments and commercialization initiatives focused on urban air taxi operations across the United States. |
| XPeng AeroHT | Question Mark | XPeng possesses strong manufacturing expertise and financial resources but remains in the early commercialization phase for consumer-oriented flying cars. Future market leadership depends on successful production scale-up and regulatory approvals. |
| Volocopter GmbH | Question Mark | Volocopter maintains strong certification progress and urban air mobility partnerships across Europe and the Middle East; however, delayed commercialization limits current market share despite high future growth potential. |
| Vertical Aerospace Ltd. | Question Mark | The company continues advancing aircraft development and certification while strengthening strategic collaborations. Commercial execution and certification timelines will determine future competitive positioning. |
| SkyDrive Inc. | Question Mark | Supported by Japan’s advanced mobility initiatives, SkyDrive demonstrates strong innovation but remains at an earlier commercialization stage compared with global leaders. |
| Boeing | Cash Cow | Boeing possesses extensive aerospace expertise, engineering resources and manufacturing capabilities. Although flying cars currently contribute a limited share of revenue, its financial strength enables continued investment in next-generation aerial mobility. |
| Airbus | Cash Cow | Airbus leverages decades of commercial aviation expertise and R&D capabilities to support long-term Advanced Air Mobility initiatives while maintaining a stable global aerospace business. |
| Lilium GmbH | Dog | Despite innovative aircraft concepts, prolonged certification timelines and commercialization challenges have limited market penetration relative to faster-moving competitors. |
Disruption Analysis
Flying cars are poised to become one of the most revolutionary transportation innovations in terms of their impact on the transportation sector in the coming decade as they revolutionize movement of both passengers and cargo in urban and regional settings. In contrast to incremental changes to current transport systems, flying cars bring about a whole new mobility layer that takes advantage of airspace at low altitudes.
The greatest disruption in the industry will take place in urban transportation where businessmen, high-end commuting individuals, as well as emergency and logistical services, are in need of faster travel times than conventional roads allow. Flying cars are able to shorten travel times up to two-thirds on many urban routes compared to regular helicopters.
In addition, there will be a disruption within the aviation industry itself. While conventional helicopters have long ruled over short-haul air transport, electric aircraft are cheaper to operate and maintain, less noisy and produce no emissions at all. Furthermore, electric aircraft provide better operating economics and greater business possibilities compared to helicopters in congested urban centers where noise pollution is a major issue.
Market Scope
| Metrics | Details | |
| 2026 Market Size | US$ 6.4 Billion | |
| 2035 Projected Market Size | US$ 5,285.0 Billion | |
| CAGR (2026-2035) | 111.1% | |
| Largest Market | Asia-Pacific, US$ 2.3 Trillion by 2035 | |
| Fastest Growing Market | Middle East and Africa, 85.5% CAGR | |
| By Type | eVTOL Aircraft Roadable Aircraft Flying Cars | |
| By Mode of Operation | Piloted Autonomous Semi-Autonomous | |
| By Seating Capacity | Single Seater Two Seater Three to Four Seater Five to Six Seater More than Six Seater | |
| By Lift Technology Architecture | Multirotor Lift & Cruise Tiltrotor Tiltwing Ducted Fan Hybrid Configurations | |
| By Propulsion Type | Fully Electric Hybrid Electric Hydrogen Fuel Cell | |
| By Range | Short Range (<50 km) Medium Range (50-150 km) Long Range (>150 km) | |
| By Maximum Take-Off Weight (MTOW) | Less than 1,000 kg 1,000-2,000 kg More than 2,000 kg | |
| By Battery Capacity (kWh Bands) | Below 100 kWh 100-200 kWh 200-350 kWh 350-500 kWh Above 500 kWh | |
| By Certification Status | Prototype (Flight Testing Phase) Pre-Certification (Type Certification in Progress) Certified (Type Certified Aircraft) Commercial Operations Approved | |
| By Production Capacity Level (Annual Units) | R&D & Prototype Only (<10 units per year) Low-Rate Initial Production (10-100 units per year) Scaled Production (100-500 units per year) Mass Production (>500 units per year) | |
| By Cruise Speed | Below 150 km per hour 150 to 250 km per hour Above 250 km per hour | |
| By Charging Infrastructure | Battery Electric Charging Hydrogen Refueling Hybrid Fuel Systems | |
| By Ownership Model | Fleet Based Operations Private Ownership Government Procurement | |
| By Aircraft Price (ASP Band) | Below US$ 1.5 Billion US$ 1.5 – 3 Billion US$ 3 – 5 Billion Above US$ 5 Billion | |
| By Application | Air Taxi Passenger Transport Cargo and Logistics Defense and Military Medical Evacuation Air Ambulance Personal Mobility Tourism and Leisure Flights | |
| By End-User | Commercial Operators Fleet Aggregators Government & Defense Emergency Services Private Owners | |
| By Region | North America | U.S., Canada, Mexico |
| Europe | Germany, UK, France, Italy, Spain, Netherlands | |
| Asia-Pacific | China, India, Japan, Australia, South Korea, Indonesia, Malaysia, Philippines, Singapore, Thailand, Vietnam | |
| South America | Brazil, Argentina | |
| Middle East and Africa | UAE, Saudi Arabia, South Africa, Nigeria | |
| Key Companies | EHang Holdings Limited Joby Aviation, Inc. Eve Holding, Inc. BETA Technologies, Inc. Archer Aviation Inc. Volocopter GmbH Vertical Aerospace Ltd. The Boeing Company AutoFlight SkyDrive Inc. Airbus SE Geely Technology Group Co., Ltd. PAL-V International B.V. XPeng Inc. Alef Aeronautics, Inc. AeroMobil, s.r.o. Honda Motor Co., Ltd. Electra.aero, Inc. Lilium GmbH TCab Technology Co., Ltd. Guangzhou Automobile Group Co., Ltd. Jetson AB Samad Aerospace Ltd. AIR EV Ltd. Horizon Aircraft Ltd. Ascendance Flight Technologies SAS SkyFly Technologies Ltd. AMSL Aero Pty Ltd Manta Aircraft S.r.l. LIFT Aircraft Inc. Jaunt Air Mobility, LLC Shanghai Volant Aerotech Co., Ltd. Pivotal Aero, Inc. Alauda Aeronautics Pty Ltd Elroy Air, Inc. Overair, Inc. Doroni Aerospace, Inc. XTI Aerospace, Inc. Samson Sky, LLC NFAS, Inc. Ryse Aero Technologies, Inc. Piasecki Aircraft Corporation Dufour Aerospace AG CycloTech GmbH FlyNow Aviation GmbH Crisalion Mobility S.L. Pipistrel d.o.o. Leonardo S.p.A. Klein Vision, s.r.o. Sirius Aviation AG Bellwether Industries Limited The ePlane Company Muyutian Aviation Technology Jiangsu Co., Ltd. ZeroG Aircraft Industry Hefei Co., Ltd. Guangdong Seagull Flying Car Group Co., Ltd. PteroDynamics, Inc. Sarla Aviation Private Limited BluJ Aerospace Pvt. Ltd. United Aircraft Group Vela Aero | |
Who Should Buy This Report in 2026?
The Sentillus Flying Cars Market Report (2026 Edition) is designed for organizations involved in the development, investment, regulation, manufacturing, deployment or adoption of Advanced Air Mobility technologies.
Aircraft Manufacturers
Identify commercialization opportunities, benchmark competing aircraft platforms, evaluate certification progress and understand emerging technology trends shaping the future flying cars industry.
Automotive OEMs and Mobility Companies
Assess opportunities for diversification into aerial mobility, identify strategic partnerships, evaluate manufacturing opportunities and understand future mobility business models.
Battery, Electronics and Component Suppliers
Analyze future demand for electric propulsion systems, batteries, semiconductors, sensors, avionics, lightweight materials and advanced manufacturing technologies supporting flying car production.
Government Agencies and Aviation Regulators
Understand global commercialization trends, certification developments, infrastructure requirements and policy initiatives supporting Advanced Air Mobility deployment.
Infrastructure Developers and Airport Operators
Evaluate opportunities related to vertiports, charging infrastructure, maintenance facilities, multimodal transportation integration and airport connectivity.
Venture Capital and Private Equity Firms
Identify high-growth technology developers, evaluate investment opportunities, benchmark competitive positioning and assess long-term commercialization potential across different market segments.
Airlines and Mobility Service Providers
Develop future fleet strategies, evaluate operational business models, understand passenger demand trends and identify opportunities within urban air taxi and regional mobility services.
Defense and Public Safety Organizations
Assess applications related to emergency response, disaster management, surveillance, border security, medical evacuation and government transportation.
Research Institutions and Universities
Support technology development, policy research, battery innovation, autonomous flight systems, urban planning and next-generation aerospace engineering initiatives.
Strategy Consultants and Corporate Planning Teams
Leverage independent market intelligence for strategic planning, competitive benchmarking, investment evaluation, partnership identification and long-term business expansion within the rapidly evolving flying cars ecosystem.
Frequently Asked Questions
Why Choose Sentillus?
Decision-Oriented Research
Sentillus delivers research designed for business decisions rather than information collection. Every study combines industry expertise, strategic analysis and practical market intelligence supporting investment, expansion and competitive planning.
Reliable Primary and Secondary Validation
Research integrates interviews with industry participants including manufacturers/service providers, dealers/distributors/agents/3rd-party suppliers and customers/consumers, public company disclosures, government publications, trade associations, consortiums, paid databases and verified industrial databases to improve analytical reliability.
Consultant-Level Industry Analysis
Every report explains why market changes occur, how competitive dynamics evolve and which developments create future business opportunities rather than simply presenting historical information.
Customized Business Intelligence
Clients receive research tailored to strategic priorities including market entry assessment, competitive benchmarking, supplier evaluation, investment opportunity analysis, pricing assessment and technology landscape studies.
Practical Competitive Insights
Competitive evaluation extends beyond company profiles by examining manufacturing capabilities, expansion strategies, product positioning, innovation priorities and strategic partnerships influencing industry leadership.
Comprehensive Regional Coverage
Country-level analysis evaluates industrial development, manufacturing capacity, production & yield, infrastructure investment, regulatory changes, trade activity and demand outlook across major global markets.
Continuous Research Support
Consultant assistance helps clients interpret findings, clarify market developments and understand industry trends after report delivery, ensuring greater value throughout the decision-making process.
High-Quality Research Standards
Every report follows a structured research methodology emphasizing data accuracy, logical analysis, clear business communication and actionable recommendations suitable for executives, investors and strategy planning teams.