

Overview
Process safety services have been transformed from occasional regulatory compliance exercises to a larger risk management service involving process hazard analysis, asset integrity, functional safety, risk quantification, emergency response, testing and auditing, and more recently, risk monitoring in a digital environment. Requirement of such services generally comes in those sectors where there is an exposure to fires, explosion, toxic substance release or loss of assets, particularly in oil & gas sector, chemicals, petrochemicals, refinery, mining and electricity production industries.
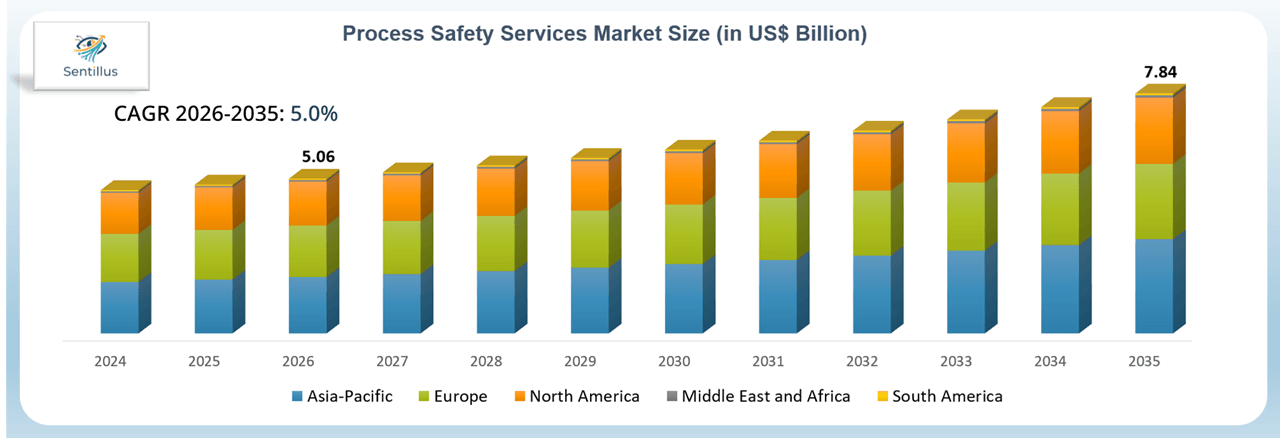
The Global Process Safety Services Market size is projected to reach USD 7.84 billion by 2035 and is estimated to grow from its value of USD 5.06 billion in 2026, at a CAGR of 5.0%. Industry growth is driven by convergence of regulatory compliance, old industrial infrastructure, growth in complex process facilities, and prevention of infrequent but very severe incidents.
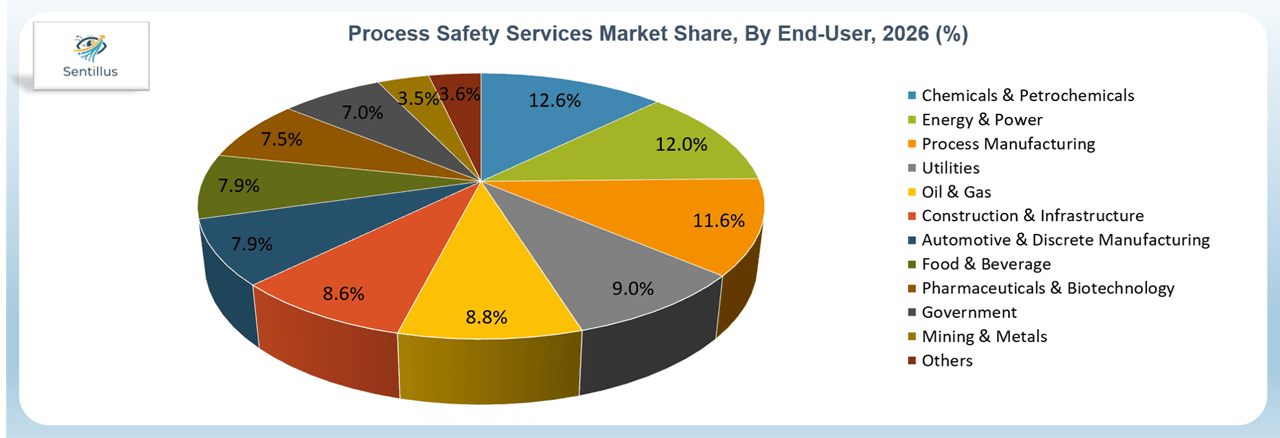
Asia-Pacific represents the largest regional market USD 1.85 billion in 2026 and records the highest regional CAGR of 5.9% through 2035. Growth in refining, petrochemicals, specialty chemicals, liquefied natural gas (LNG), semiconductor fabrication, and other heavy process industries is expanding the industrial risk exposure of the region. Formalization of regulatory structures is also a key trend. China, for instance, implemented the new “Hazardous Chemicals Safety Law” in December 2025, which deals with production, storage, use, operations and transportation of hazardous chemicals.
Europe follows closely at USD 1.68 billion in 2026. A highly institutionalized major-accident prevention environment supports recurring expenditure on process-safety services. More than 12,000 establishments are currently reported through the European Commission’s eSPIRS system across the EU plus Iceland and Norway under the Seveso framework. Operators covered by major-hazard legislation face requirements involving accident-prevention policies, safety management systems, safety reports, emergency planning and inspections, providing a substantial recurring addressable base for external safety specialists.
North America accounts for USD 1.44 billion in 2026. Unlike emerging markets where greenfield industrial development contributes significantly to demand, North American requirements combine operating-asset risk management with mature regulatory obligations. OSHA’s Process Safety Management standard requires covered employers to conduct process hazard analyses and revalidate them at least every five years while compliance audits must occur at least every three years. Such recurring requirements create a structurally recurring market for PHA facilitation, PSM auditing, mechanical-integrity assessment, training and compliance consulting.
Middle East & Africa and South America are considerably smaller in the supplied market dataset at USD 49 million and USD 45 million respectively in 2026. Growth prospects still remain focused around processes involving hydrocarbons, liquefied natural gas (LNG), petrochemicals, mining, and large industrial facilities due to the fact that the economic ramifications of a process failure necessitate a safety engineer with expertise.
The Risk Assessment Services is the largest service type valued at USD 741 million in 2026 and expected to rise to USD 1.15 billion by 2035. The Process Safety Testing & Laboratory Services is the highest growing service type in terms of revenues from USD 633 million in 2026 to USD 1.16 billion in 2035, corresponding to a CAGR of around 7.0%.
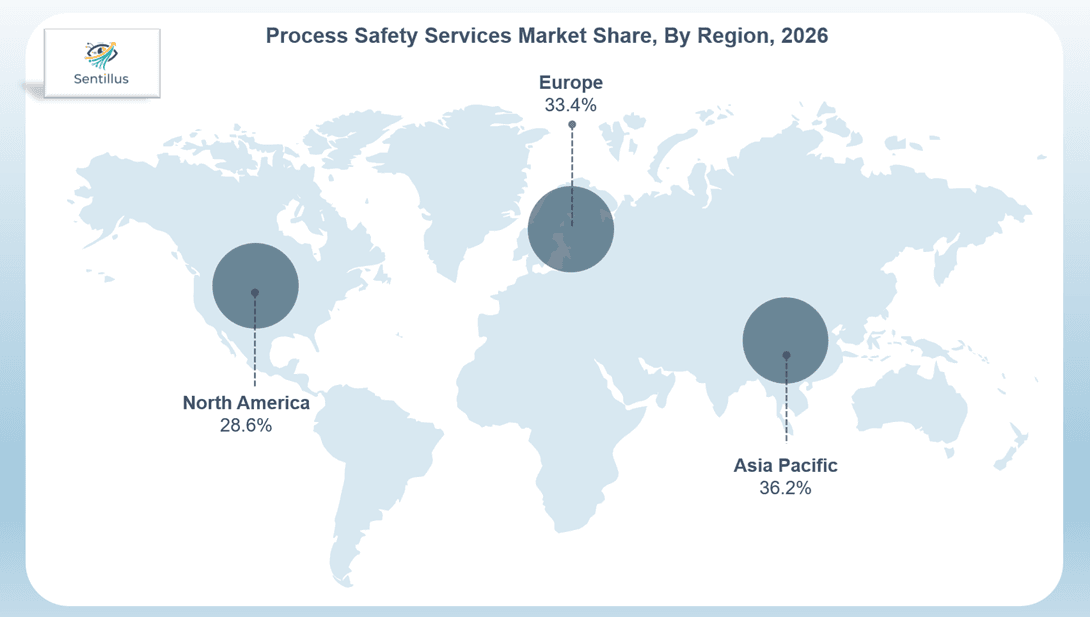
The Mechanical Integrity & Asset Reliability is the largest safety domain which will be valued at USD 806 million in 2026 and expected to increase to USD 1.37 billion by 2035 at a CAGR of 6.1%. The Large Industrial Complexes is the largest plant size which will be worth approximately USD 2.0 billion in 2026 and will rise to USD 3.2 billion by 2035. The Oil & Gas is the fastest growing end-user with a CAGR of 6.9%.
Market Driver
Recurring Regulatory Obligations Create a Structural Process Safety Services Market
Process safety differs from many discretionary engineering services because major regulatory frameworks require operators to continuously reassess hazards rather than demonstrate compliance only when a facility is commissioned. The United States provides one of the clearest examples. OSHA 29 CFR 1910.119 requires covered processes to maintain process-safety information, conduct process hazard analyses, implement operating procedures, manage mechanical integrity, investigate incidents and undertake compliance audits.
PHAs must be updated and revalidated at least once every five years, while PSM compliance audits must occur at least once every three years. EPA creates an additional compliance layer through 40 CFR Part 68 Risk Management Program requirements. Covered facilities are required to maintain programs addressing hazard assessment, accident prevention and emergency response while regulated facilities generally revise and resubmit their Risk Management Plans every five years.
Refineries, chemical plants or gas facilities should not consider the safety of their processes a one-off engineering exercise because constant changes to their processes will continue to provide opportunities for assessment by specialists. Europe provides a similar recurring service market through Seveso III, where over 12,000 high-risk installations are registered to European Commission’s eSPIRS system, thus forming a sizable installed base requiring major accident prevention. It implies that regulation will generate demand for HAZOP, LOPA, QRA, PSM audit, safety case production, mechanical integrity assessment, functional safety assessment, emergency plan, and compliance advisory services.
Market Opportunity
Aging Assets and Mechanical Integrity Create a High-Value Service Opportunity
Mechanical integrity is gradually emerging as one of the most lucrative aspects of process safety, with operators desiring to increase the life of their industrial facilities without exposing themselves to the risk of any major accidents. Currently, Mechanical Integrity & Asset Reliability is already considered the largest safety-domain worth USD 806 million in 2026, expected to reach USD 1.37 billion in 2035. Refineries, chemical processing plants, offshore facilities, LNG terminals and processing plants comprise complex systems of pressure vessels, piping, rotating machinery, storage tanks, relief devices and instrumentation. Degradation of asset leads to corrosion, fatigue, erosion, and containment hazards, which cannot be mitigated using procedural safety management alone.
OSHA’s PSM framework reinforces the commercial requirement by requiring covered employers to address the mechanical integrity of process equipment and document conformance with recognized and generally accepted good engineering practices. Opportunity therefore extends beyond conventional inspection into risk-based inspection, remaining-life assessment, corrosion management, integrity management, non-destructive testing, reliability engineering and predictive asset monitoring.
Digital Process Safety Expands the Market Beyond Traditional Consulting
Digital technologies are gradually changing how industrial companies manage process risk. Traditional process safety has always been based largely on scheduled workshops, physical inspections, engineering calculations and document reviews. Instrumentation that is connected, digital twins, remote inspection and predictive analysis are helping to move parts of the industry towards continuous risk monitoring. Growth will not eliminate conventional HAZOP, LOPA or QRA services because regulated safety decisions continue to require engineering judgment. Digital tools instead expand the scope available to service providers by integrating engineering analysis with operating data.
Emerging applications include:
- Digital barrier management
- Predictive asset-integrity analytics
- Remote inspection
- Digital-twin-supported scenario analysis
- Automated alarm and event analysis
- AI-assisted hazard identification
- Process-safety performance monitoring
Providers combining process-engineering expertise with digital capabilities are therefore positioned to capture a larger portion of customers’ lifecycle safety expenditure.
Segment Analysis
By Service: Process Safety Testing & Laboratory Services Record the Highest Growth
Process Safety Testing & Laboratory Services will grow from USD 633 million in 2026 to USD 1.16 billion by 2035, thus making it the fastest growing service sub-segment at approximately 7.0% CAGR. The sophistication of tests is increasing due to the fact that manufacturers need to test the chemical and physical properties of newly processed chemicals, powders, battery materials, specialty compounds, and alternative fuels, whose reactions need to be determined before safe operational limits can be determined.
By Safety Domain: Mechanical Integrity & Asset Reliability Holds the Largest Share
Mechanical Integrity & Asset Reliability will yield an estimated revenue of USD 806 million in 2026, which is projected to grow up to USD 1.37 billion in 2035, exhibiting a CAGR of 6.1%. With the process industries focusing on getting more out of their assets without any loss of containment, there is a move from time-based inspection to risk and condition based inspections. The sub-segment receives considerable benefit from the refineries, petrochemicals, LNG, chemicals and off-shore units where any downtime is very costly.
By Plant Size: Large-Scale Industrial Complexes Dominate Demand
Industrial complex projects constitute approximately USD 2.0 billion in the market in 2026 and are projected to grow to approximately USD 3.2 billion in 2035, which corresponds to a CAGR of 5.4%. Industrial complexes have several interconnected processing units, along with much larger quantities of dangerous chemicals. As complexity grows, there is more need for multidisciplinary HAZOP analysis, QRA, consequence modeling, functional safety engineering, asset integrity, and emergency response plans. The economics also favour specialist external providers because maintaining equivalent expertise internally across every risk discipline can be expensive.
By End-User: Oil & Gas Emerges as the Fastest-Growing Industry
Oil & Gas will register the highest CAGR of 6.9% among all end-users. Process safety regulations apply to the entire chain of hydrocarbons processing from offshore production facilities, gas processing plants, refineries, liquefied natural gas plants to pipelines and storage sites. Flammable inventories, high operating pressures and temperatures and interconnected processing systems make consequence severity substantially higher than in many conventional manufacturing environments. Expansion of LNG, petrochemicals and complex refining alongside continued operation of existing assets creates simultaneous requirements for greenfield safety engineering and brownfield integrity management.
Geographical Analysis
United States Process Safety Services Market Analysis
The United States remains one of the most mature process-safety markets within North America because regulatory compliance is integrated into the operating lifecycle of hazardous industrial facilities. OSHA 29 CFR 1910.119 applies to specified highly hazardous chemical processes and processes involving qualifying quantities of flammable gases or liquids. The framework encompasses process safety information, PHA, operating procedures, training, mechanical integrity, management of change, incident investigation, emergency response and compliance auditing.
A particularly important commercial characteristic is recurrence. PHA revalidation occurs at least every five years while compliance audits are required at least every three years. Such requirements create predictable demand for third-party process-safety specialists rather than dependence exclusively on new industrial construction. EPA’s RMP framework adds risk-management and emergency-preparedness requirements. Facilities subject to RMP generally resubmit their plans every five years.
Regulatory policy is currently changing. EPA announced reconsideration of its 2024 Safer Communities by Chemical Accident Prevention rule in March 2025 and proposed further revisions in February 2026. Regulatory transition itself can create advisory demand as operators evaluate which requirements remain applicable and modify compliance programs accordingly.
Europe Process Safety Services Market Analysis
Europe represents approximately USD 1.68 billion in 2026 and expands at a CAGR of 4.4%. Its market position is supported by a particularly dense regulated industrial base. More than 12,000 establishments across the EU plus Iceland and Norway are reported through eSPIRS under the Seveso framework. Chemical manufacturing clusters in Germany, France, Belgium, Netherlands and Italy create substantial requirements for major-accident risk management. North Sea offshore operations add another sophisticated market for barrier management, quantitative risk analysis, integrity engineering and safety-case services. European growth is consequently less dependent on rapid facility construction than Asia-Pacific and more dependent on recurring compliance, aging-asset management, decarbonization projects and modification of existing industrial plants.
Asia-Pacific Process Safety Services Market Analysis
Asia-Pacific is expected to reach approximately USD 1.85 billion in 2026 and exhibit the highest regional CAGR of 5.9%. The growth of industries makes the region distinguish itself from developed Western regions. Many ongoing projects for chemicals, refining, LNG, electronics and advanced manufacturing capacity in China, India and Southeast Asian economies are boosting the demand while Japan, South Korea, Singapore and Australia possess already established industrial safety practices.
- An important legislative initiative is the Hazardous Chemicals Safety Law, passed in China on December 27, 2025 that offers legal coverage for hazardous-chemical production, storage, use, operation and transportation.
- Singapore imposes dedicated Major Hazard Installation requirements. The operators under the Workplace Safety and Health (Major Hazard Installations) Regulations should ensure minimization of major-accidents risks and maintain and implement the safety case.
- In Australia, the major hazard facilities should identify major incident hazards, conduct safety assessments, safety management systems, emergency plans and safety cases within the model WHS regime.
Regulatory Landscape
| Country/Region | Core Framework | Major Process-Safety Requirement | Service-Market Impact |
| United States | OSHA PSM – 29 CFR 1910.119 | PHA, mechanical integrity, MOC, training, incident investigation and 3-year compliance audits | Strong recurring PHA, PSM audit and integrity-management demand |
| United States | EPA RMP – 40 CFR Part 68 | Hazard assessment, prevention program, emergency response and RMP submissions | Supports consequence modelling, RMP consulting and emergency planning |
| European Union | Seveso III – 2012/18/EU | Major-accident prevention, SMS, safety reports and emergency planning | Creates broad recurring compliance market across >12,000 establishments |
| United Kingdom | COMAH 2015 | Major-accident prevention policies, safety reports and emergency arrangements | Supports safety-case, QRA and compliance services |
| Germany | Seveso III / Störfall-Verordnung | Major-accident prevention and hazardous-establishment controls | Strong chemical-sector consulting market |
| France | Seveso III / ICPE framework | Hazard studies, operating controls and major-hazard prevention | Supports risk studies and regulatory engineering |
| Italy | Seveso III implementation | Major-accident prevention and emergency preparedness | Recurring compliance and risk-management services |
| Netherlands | Seveso III national implementation | Major-hazard management and inspection | Strong QRA and safety-engineering requirements |
| Norway | Offshore HSE regulatory framework | Risk reduction, barrier management and integrity | High-value offshore risk and technical-safety services |
| China | Hazardous Chemicals Safety Law | Hazardous chemical production, storage, use, transportation and emergency management | Strengthens safety engineering and compliance demand |
| India | Factories framework/MSIHC Rules and sector requirements | Hazard identification, hazardous-process controls and emergency planning | Supports audit, HAZOP and compliance consulting |
| Singapore | WSH (Major Hazard Installations) Regulations | Safety case, major-accident risk reduction and MHI registration | Strong specialist process-safety market |
| Australia | WHS Major Hazard Facility framework | Safety assessment, SMS, emergency plan and safety case | Supports risk assessment and safety-case consulting |
| South Korea | Occupational Safety and Health framework / PSM requirements | Process risk management at qualifying hazardous facilities | Supports PSM auditing and engineering |
| UAE | Federal/local requirements plus operator standards | Industrial risk management particularly across hydrocarbons | Specialist oil & gas safety-engineering demand |
| Saudi Arabia | Industrial security and operator requirements | Hazard prevention and industrial-facility protection | Supports engineering, inspection and audit services |
| Brazil | NR framework including NR-20 | Safety management for flammable and combustible substances | Training, risk assessment and compliance demand |
OSHA requirements cited above are directly supported by the current standard. European establishment count is supported by the European Commission. Australian MHF obligations are supported by Safe Work Australia. Singapore’s MHI requirements are established under its dedicated regulations.
Regulation-to-Service Demand Matrix
| Regulatory/Operational Requirement | Service Demand Generated |
| Process Hazard Analysis | HAZOP, HAZID, What-if, FMEA |
| PHA Revalidation | Recurring HAZOP/PHA consulting |
| Major-Accident Risk Assessment | QRA and consequence modelling |
| Safety Instrumented Systems | SIL determination and verification |
| Mechanical Integrity | RBI, NDT, corrosion and reliability engineering |
| Management of Change | MOC assessment and documentation |
| Safety Case | Safety-case development and verification |
| Emergency Planning | ERP, consequence modelling and emergency exercises |
| Compliance Audit | PSM/RMP/Seveso/COMAH audits |
| Incident Investigation | Root-cause analysis and forensic engineering |
| Hazardous Material Testing | Explosion, flammability and reaction testing |
| Digital Risk Management | Barrier monitoring, predictive analytics and digital twins |
BCG Matrix Analysis
| Quadrant | Companies | Strategic Position |
| Stars | SGS, Bureau Veritas | Broad international TIC networks, extensive industrial customer access and active expansion through acquisitions strengthen their ability to cross-sell safety, inspection, compliance and risk services. |
| Cash Cows | Siemens, Schneider Electric, Honeywell, ABB, Emerson | Large installed bases in industrial automation and control provide recurring lifecycle opportunities in functional safety, control-system modernization and plant risk management despite comparatively mature core businesses. |
| Question Marks | DEKRA, DNV, TÜV SÜD, TÜV Rheinland, Yokogawa, Intertek | Strong specialist capabilities and exposure to high-growth safety requirements provide expansion potential although process-safety market scale is lower than the largest diversified industrial groups. |
| Tailenders | AECOM, KBR, Fluor, JGC, Rockwell Automation, dss+ and smaller specialist providers* | Process safety represents part of broader engineering, automation or consulting portfolios. Competitive strength is frequently concentrated in particular industries, projects or geographies rather than the complete global service spectrum. |
Competitive Landscape
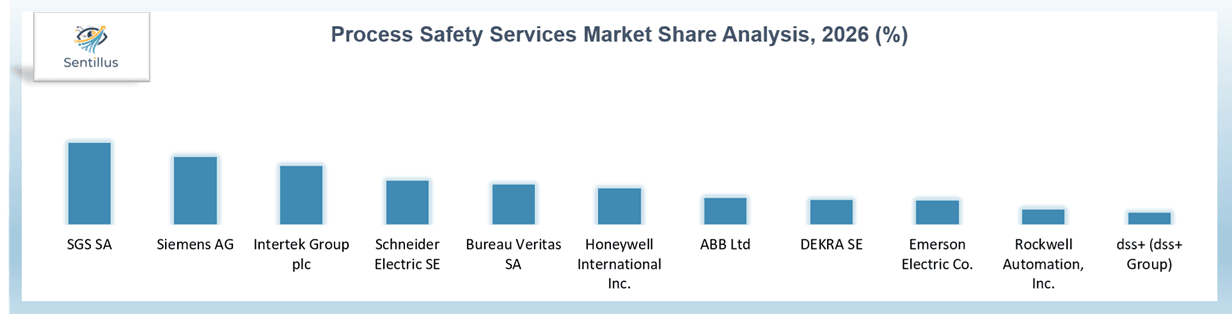
Competition in process safety services is unusually fragmented because the market sits between testing and inspection companies, engineering consultancies, automation companies, specialist risk consultancies and certification organizations.
SGS and Bureau Veritas possess scale advantages arising from global inspection networks, established industrial customer relationships and broad compliance portfolios. DEKRA and DNV hold strong technical positions in industrial risk, process safety and asset assurance while TÜV organizations benefit from certification and functional-safety capabilities.
Automation companies such as Honeywell, ABB, Siemens, Schneider Electric, Emerson, Rockwell Automation and Yokogawa occupy a different competitive position. Their process-safety exposure increasingly arises from safety instrumented systems, automation lifecycle services, digital monitoring and industrial control platforms rather than traditional independent consulting alone.
AECOM, KBR, Fluor and JGC participate principally through engineering and project execution capabilities, particularly where process-safety studies form part of FEED, EPC or plant-modification programs. Competitive differentiation is consequently moving toward the ability to integrate engineering judgement, regulatory expertise, testing capabilities, asset integrity and digital technology within a single lifecycle service offering.
Recent Developments
June 2025 – SGS Strengthens North American Safety Capabilities
SGS acquired H2Safety, a Canadian emergency-management and operational-safety specialist. H2Safety brought 86 professionals and capabilities spanning emergency management, business continuity, risk mitigation and regulatory compliance. The transaction directly strengthens SGS’s North American Health & Safety platform and is one of the strongest recent developments for this RD.
July 2025 – SGS Expands Specialized Industrial Testing Through ATS
SGS signed an agreement to acquire Applied Technical Services, a U.S. testing, inspection, calibration and forensics company. ATS was expected to contribute approximately USD 460 million of sales and USD 95 million EBITDA before synergies in 2026, supported by 2,100 employees and 85 facilities. Exposure to manufacturing and power infrastructure expands SGS’s industrial asset-assurance capabilities.
September 2025 – Applus+ Expands Environmental and Technical Advisory Platform
Applus+ agreed to acquire APEM Group for approximately £335 million, creating a new global Environmental Services business. APEM serves industries including water, renewables, infrastructure, power, utilities and ports across several regions. I would position the deal as an adjacent technical-advisory expansion, not claim that APEM itself is principally a process-safety company.
The ABB-NVIDIA item from your image should also be treated as a digital industrial technology development, not a direct process-safety services transaction unless the underlying announcement explicitly links the deployment to safety lifecycle services.
Future Outlook
The Process Safety Services Market is anticipated to undergo a paradigm shift from the current compliance-led services market towards continuous lifecycle risk management until 2035. Classical HAZOP, PHA, QRA, and audits are essential due to the mandatory nature of major hazard legislation which cannot easily be automated.
Oil & Gas will remain particularly important given its forecast 6.9% CAGR and high consequence-of-failure profile. LNG projects, gas processing, refining, petrochemical integration, and aging hydrocarbons will provide demand for safety engineering in new projects and in existing plants through integrity management programs. The Asia-Pacific will become more dominant since the 5.9% compound annual growth rate of this region will be higher than in the well-established Western markets. Development of industry will be accompanied by stricter regulations, especially on the handling of hazardous chemicals.
Testing and laboratory services represent another structural shift. Their projected 7.0% CAGR suggests customers are placing greater emphasis on scientifically establishing material and reaction hazards rather than relying solely on procedural controls. Digitalization will gradually alter service delivery. Digital twinning, remote inspections, connected integrity management systems, and predictive analytics will make it possible to switch from periodic safety management to continuous monitoring. However, engineering knowledge of humans will still play an important role because the area of process safety deals with low-frequency but high-impact incidents.
Who Should Buy This Report
Process Safety Services market intelligence provides strategic value to industrial operators, service providers, technology suppliers and investors seeking to understand the regulatory and operational expenditure associated with managing major industrial hazards.
Primary beneficiaries include oil & gas producers, refinery operators, chemical and petrochemical manufacturers, LNG developers, mining companies, power generators, engineering and EPC contractors, process-safety consultancies, TIC companies, automation and control-system suppliers, asset-integrity providers, insurance and industrial-risk organizations, private-equity firms, institutional investors and government safety authorities.
The report will help stakeholders evaluate service growth, regulatory exposure, geographic expansion opportunities, competitive positioning, acquisition opportunities and emerging digital process-safety requirements.
Frequently Asked Questions
Why Choose Sentillus?
Decision-Oriented Research
Sentillus delivers research designed for business decisions rather than information collection. Every study combines industry expertise, strategic analysis and practical market intelligence supporting investment, expansion and competitive planning.
Reliable Primary and Secondary Validation
Research integrates interviews with industry participants including manufacturers/service providers, dealers/distributors/agents/3rd-party suppliers and customers/consumers, public company disclosures, government publications, trade associations, consortiums, paid databases and verified industrial databases to improve analytical reliability.
Consultant-Level Industry Analysis
Every report explains why market changes occur, how competitive dynamics evolve and which developments create future business opportunities rather than simply presenting historical information.
Customized Business Intelligence
Clients receive research tailored to strategic priorities including market entry assessment, competitive benchmarking, supplier evaluation, investment opportunity analysis, pricing assessment and technology landscape studies.
Practical Competitive Insights
Competitive evaluation extends beyond company profiles by examining manufacturing capabilities, expansion strategies, product positioning, innovation priorities and strategic partnerships influencing industry leadership.
Comprehensive Regional Coverage
Country-level analysis evaluates industrial development, manufacturing capacity, production & yield, infrastructure investment, regulatory changes, trade activity and demand outlook across major global markets.
Continuous Research Support
Consultant assistance helps clients interpret findings, clarify market developments and understand industry trends after report delivery, ensuring greater value throughout the decision-making process.
High-Quality Research Standards
Every report follows a structured research methodology emphasizing data accuracy, logical analysis, clear business communication and actionable recommendations suitable for executives, investors and strategy planning teams.